Check data quality |
  
|
Check data quality |
|
(go directly to our Notes on Meteo)
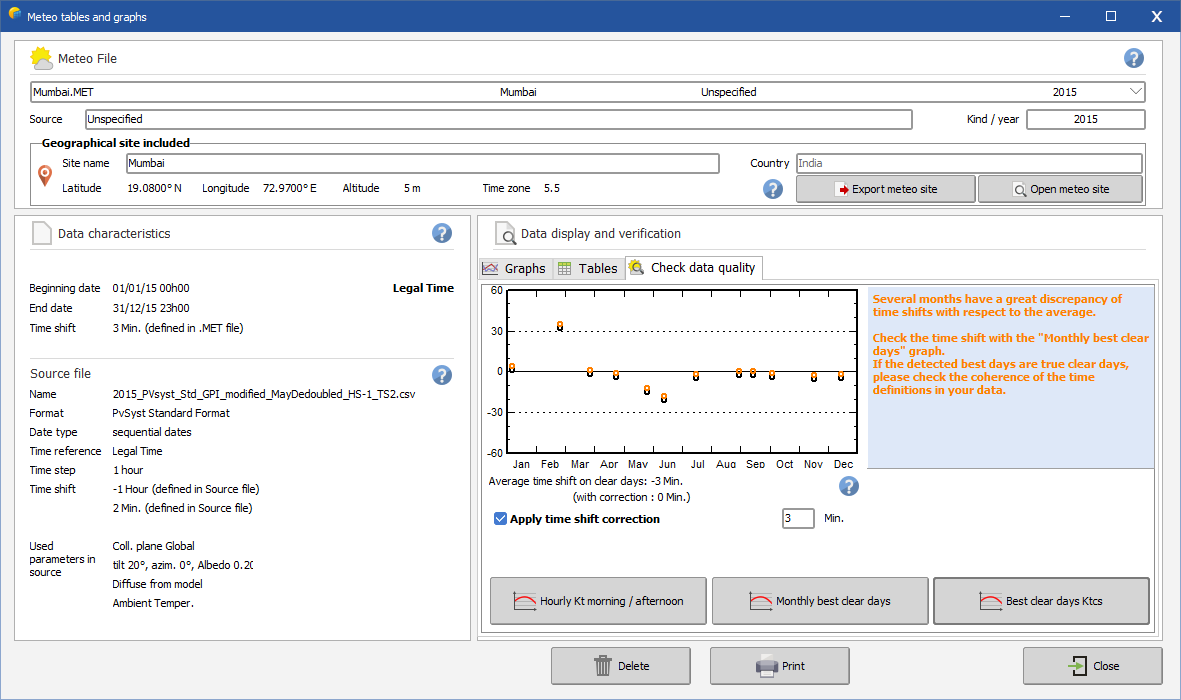
Checking the quality of data is an essential step in achieving relevant simulation results. PVSyst proposes 4 graphs to do this evaluation :
- the time shift of monthly best days with
respect to the clear day model (available on the "Check data
quality" tab),
- the cloud of hourly Kt in
the morning and in the evening (with the possibility to challenge
shifts),
- the daily irradiance profile
graph of monthly best days, and their comparison with the
clear day model profile.
- and finally the ranking of
days according to their clearness index.
To understand how to
use those graphs, fully read our Guidelines one
Data Quality Check and on
Time Shift.
It is also recommended to read also our note on
horizon in *.MET files.