Meteonorm data and program |
  
|
Meteonorm data and program |
|
(Go directly to Importing Meteonorm Data)
Meteonorm
The Meteonorm software (V3.0, 1997; V4.0, 2000; V5.0, 2003; V6.0, June 2007; V6.1, 2009; V7.0, 2012; V7.1 2015; V7.2 2017; V7.3 2019; V8.0 2020) provides basically monthly meteorological data for any location on the earth.
It also generates synthetic hourly values from these monthly values, using stochastic models which have been improved in the latest versions.
Data covers useful information for PVSyst:
·Global horizontal irradiance (GHI or GlobHor)
·Diffuse horizontal irradiance (DiffHor)
·Wind Speed
·Temperature
In the Meteonorm irradiance dataset, please note that :
·the effect of far shadings from mountains at sunrise and sunset is not included, which means that in mountaneous regions an horizon mask must be further applied in the project area of PVSyst.
·users of the
Meteonorm software have the possibility to add a skyline
profile before applying the
synthetic hourly generation, but it is not
recommended to so do. Preferably the horizon mask should be
added in PVSyst to ensure a correct transposition of diffuse onto
the plane of array.
Details of the Method (from
the source of the Meteonorm V8.x Handbook
(Software))
·Ground stations
The Meteonorm database contains a total of 8'325 weather stations. For worldwide applications, severa l different international databases are included :
- Global radiation data
was taken from the GEBA Global Energy Balance Archive (WMO World
Climate Program - Water) (Gilgen et al., 1998). The data was
quality controlled using six separate procedures (checking of
physical probability, time series analysis and comparison of cloud
data).
- Temperature, humidity, wind
data, sunshine duration and days with rain were taken from
WMO Climatological Normals 19611990 (WMO, 1998). To replace
missing data and ensure a homogeneous distribution of weather
stations, other databases such as the data summary of international
weather stations compiled by the National Climatic Data Center, USA
(NCDC, 1995/2002) were added. For some stations in the USA, monthly
mean values 19611990 of global radiation of the National Renewable
Energy Laboratory (NREL) database "The Solar Radiation Data Manual
For Buildings" were used.
For version 7.0 six data sources were updated:
Swiss database (based on Swissmetnet of MeteoSwiss): The main period for radiation was extended to 19862005 for radiation and to 20002009 for temperature, wind and precipitation.
Globalsod data (NCDC, 2002): The parameters temperature, wind speed (10 m above ground) and precipitation were processed to 20002009 means.
GEBA: The main period was extended to 19862005.
Turkish State Meteorological Service: 9 stations with global radiation from 20042013 were added.
NREL: Monthly means of selected TMY3 sites (those within the lowest uncertainty class) were added.
The monthly average radiation values were calculated for periods of
at least 10 years. Although the 10-year periods differ between the
stations, a uniform period was used for each continent. For some
stations the data was extended with data from neighboring stations
using a differential procedure.
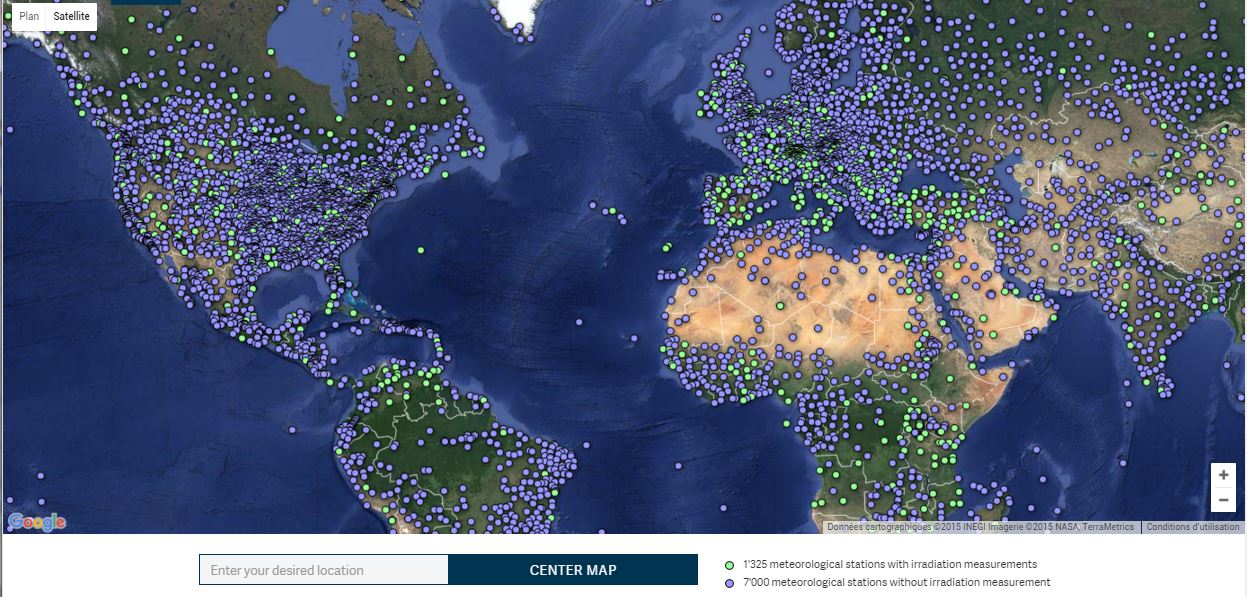
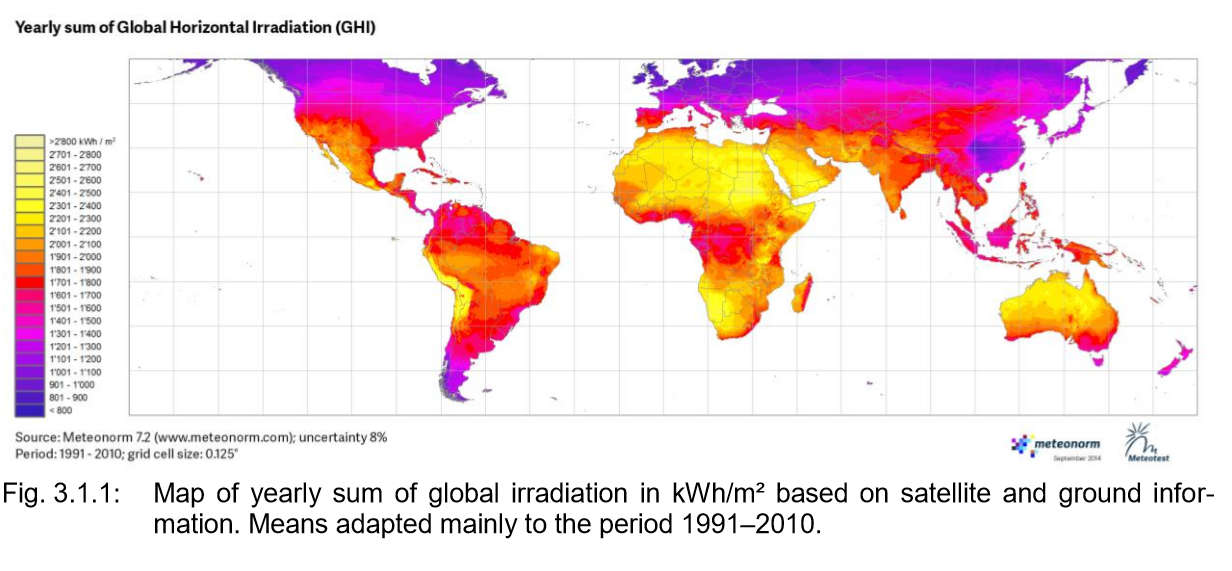
·Satellite data
In version 7.1 satellite data is
used for radiation interpolation in
remote areas (Fig. 3.1.1). Where no radiation measurement is
available nearer than 200 km (Europe: 50 km) from the selected
location, satellite information is used. If the nearest site is
more than 30 km (Europe: 10 km) away, a mixture of ground and
satellite information is used.
The method used for processing the satellite images is an approximation of methods like Heliosat II (Lefèvre et al., 2002): The 3 hourly pictures of the visible channel of the 5 geostationary satellites have been used (period 2009-2014). The satellite pictures are processed to daily means of global radiation and summed up to monthly values. These monthly values are interpolated with mean ground measurements (mainly GEBA data). The difference between the ground measurements and satellite information is interpolated spatially with the inverse distance method. This provides a result which includes the values at the ground stations and the variation of the satellite pictures.
For Europe a high resolution
(23 km) satellite map has been compiled by MeteoSwiss based on
images from 20042010 of the visible and the infrared channel of
Meteosat Second Generation satellite. This data is included in
Meteonorm version 7.1. For Africa data for the period 1986-2005
from CMSAF4 (DWD) is used. For the rest of the world satellite data
is from the period 2009-2013 and has a resolution of 8 km
In the Meteonorm software:
·"Stations" mean the meteorological stations which provide irradiance measurements.
·"WMO/OMM" are meteorological stations recording several parameters, but for which the irradiance is not measured (7'000 sites).
·"Towns" are a set of some large cities, for which the data have been interpolated.
In the "Sites" part, the PVsyst "native" database lists all "Stations" with well-measured irradiation, but allows to choose graphically any place on the earth for getting interpolated values. Although any location is directly available within the program, PVsyst also allows to import Files produced by the Meteonorm software (old or new versions). Full documentation about the Software and the theory are available from the web site www.meteonorm.com.
·Compared to version 7.1, Version 7.2 includes updated meteorological and turbidity data and additional features:
·Database:
oUpdate of the time periods for temperature, humidity, precipitation and wind speed: periods 19611990 and 20002009; for radiation parameters 19811990, 19912010 and 19962015.
oUpdate of the satellite database. Satellite maps based on 5 geostationary satellites has been updated and enhanced especially for areas with high albedo.
oNew turbidity climatology based on Gueymard (2012).
·Models:
oNew models for calculation of one minute radiation data.
·Compared to version 7.2, Version 7.3 includes no access to ongoing hourly timeseries and includes detailed urban heat models for Barcelona, Bern, Rome and Vienna:
·Database:
oUpdate of precipitation and days with precipitation to the period 20012015.
oUpdate of the solar resources in Brazil.
oAccess to ongoing current time series based on satellite (Europe, Africa, Near East) and Re-Analysis data (ERA-5, rest of the world).
·Models:
oDetailed model for urban effects based on H2020 climate-fit.city project for Barcelona, Bern, Rome and Vienna (more cities will follow in ongoing patches).
oNew Solis 2017 clear sky model (Ineichen, 2018).
·Compared to version 7.3, Version 8.0 is based on more recent data from the following periods:
·19962015: new main period for radiation parameters.
·20002019: new main period for temperature, dew point temperature, wind, precipitation and days with precipitation.
This recent time period is denoted in the new Version as contemporary. It is still possible to choose a historic data period (19811990 for radiation and 19611990 for temperature).
·Database:
oAccess to ongoing current time series based on satellite worldwide (55°S to 65°N) and Re-Analysis data (ERA-5T) for the rest of the world.
oNew satellite data: Now based on an own, globally homogeneous satellite model (Schmutz et al.,2020), including satellite data for Asia and the Americas.
oFuture data for IPCC Scenarios RCP 2.6,4.5 and 8.5 from 10 global climate models based on CMIP5 are included.
·Models:
oDetailed model for urban effects based on the H2020 climate-fit.city project. 100 cities in Europe include urban effects for the contemporary climates. Barcelona, Berlin, Bern, Bremen, Prague, Rome and Vienna additionally include urban effects of 2050 for two scenarios.