The
distribution of yearly Irradiation values for several years
(at least 10-15 years) is evaluated using a Gaussian
distribution.
The
year-to-year variability is the width (RMS) of this gaussian
function.
Evaluation
| - |
The year-to-year variability is
now provided by the Meteonorm
database. |
|
|
It is displayed in the
"Geographic site" dialog,
page "Monthly Meteo",
after importing the data from Meteonorm 7.2. |
| - |
If you get multi-years data from a meteorological
data provider, you can evaluate the variability of these data using
the tool "Databases
> Compare Meteo data". Here you can choose the years to
be accumulated, and choose the "Histo and probabilities" option
to see the corresponding plot. |
| - |
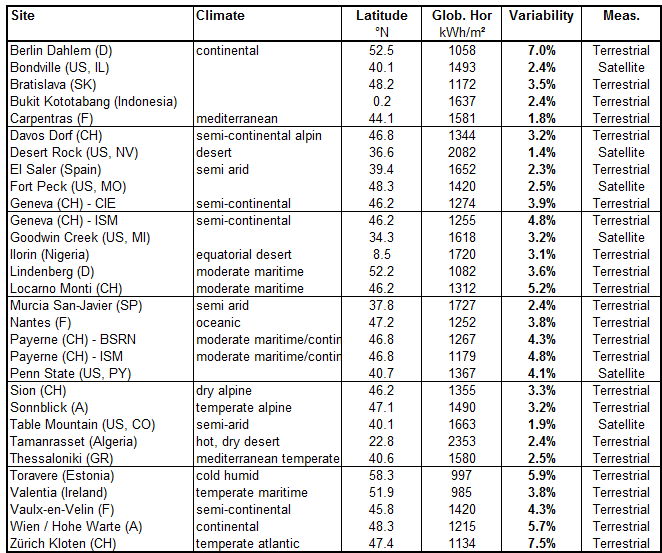
The variability of the meteo data
has been studied in detail by Pierre Ineichen for about 30
different sites, in a document available from our web site
(cf ) |
|
|
He has collected data from
different sources, and analyzed time series of 10 to 30 years for
each of the 30 sites studied. |
|
|
The main results are gathered on
the table given below. |
|
|
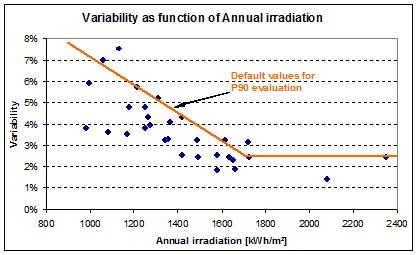
It appears that the variability
is dependent on the annual
irradiance: this may be explained by the fact that with
sunny climates with many clear days, the possibility of middle or
bad days is lower. |
|
|
Therefore for use of these data
in the evaluation of the
P90 values, we have established an upper estimate which
is used as default value. |